Transform Your Research Ideas into Publication-Ready Graphics
Our AI-powered platform instantly converts your scientific text and data into stunning, accurate visuals. Save time and elevate your publications.
Average generation
Visuals created
Accuracy rate
Create any scientific visual
From molecular structures to complex data visualizations
Full visual summaries with icons, sections, and flow diagrams
Molecular Biology
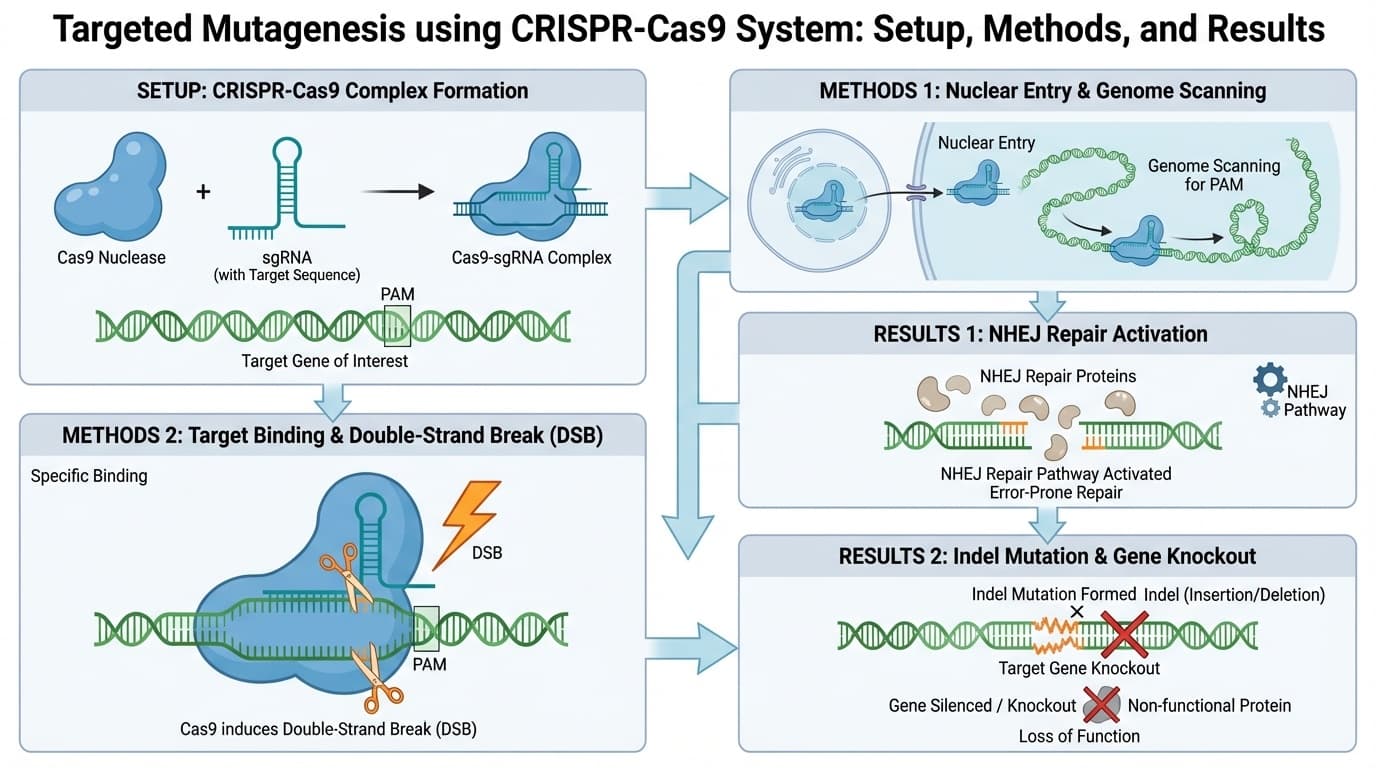
CRISPR-Cas9 Gene Editing Mechanism
Neuroscience
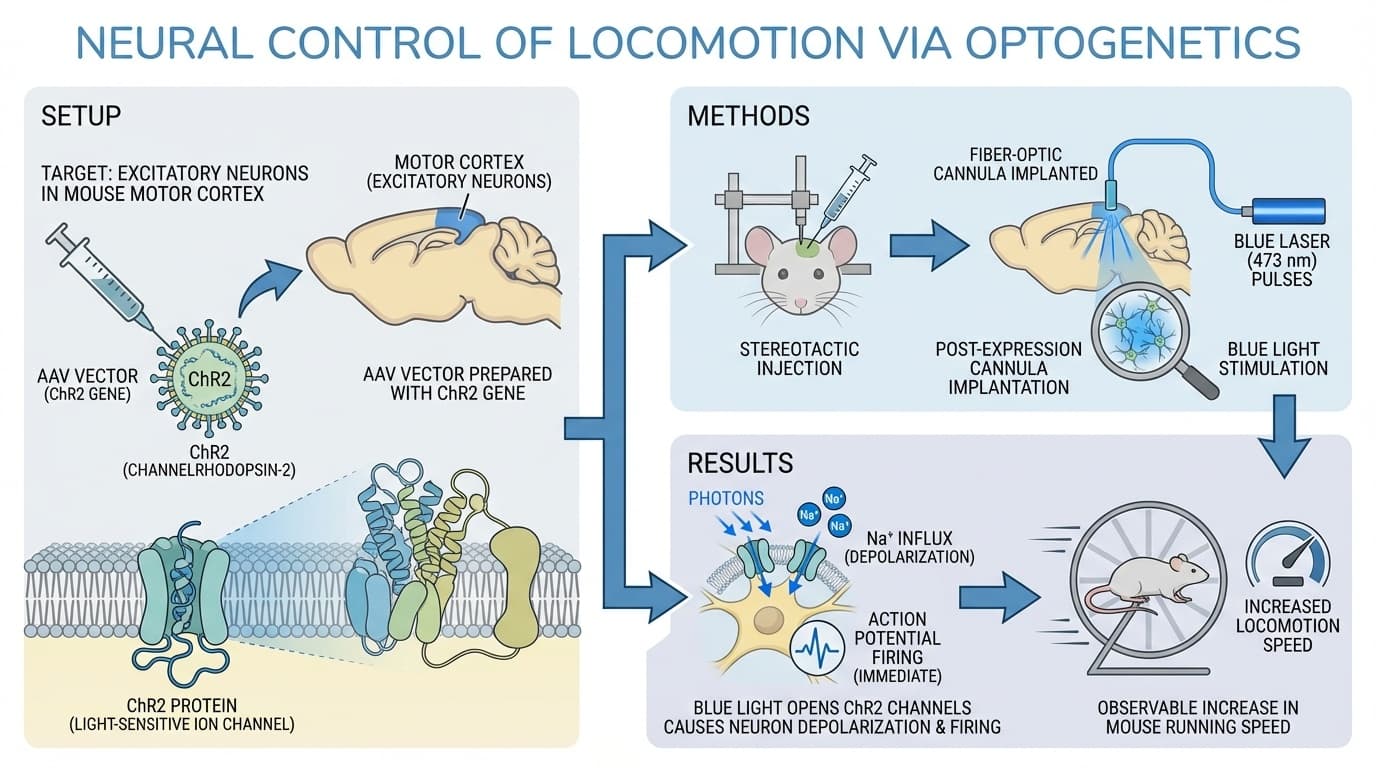
Optogenetics in Behavioral Studies
Chemistry
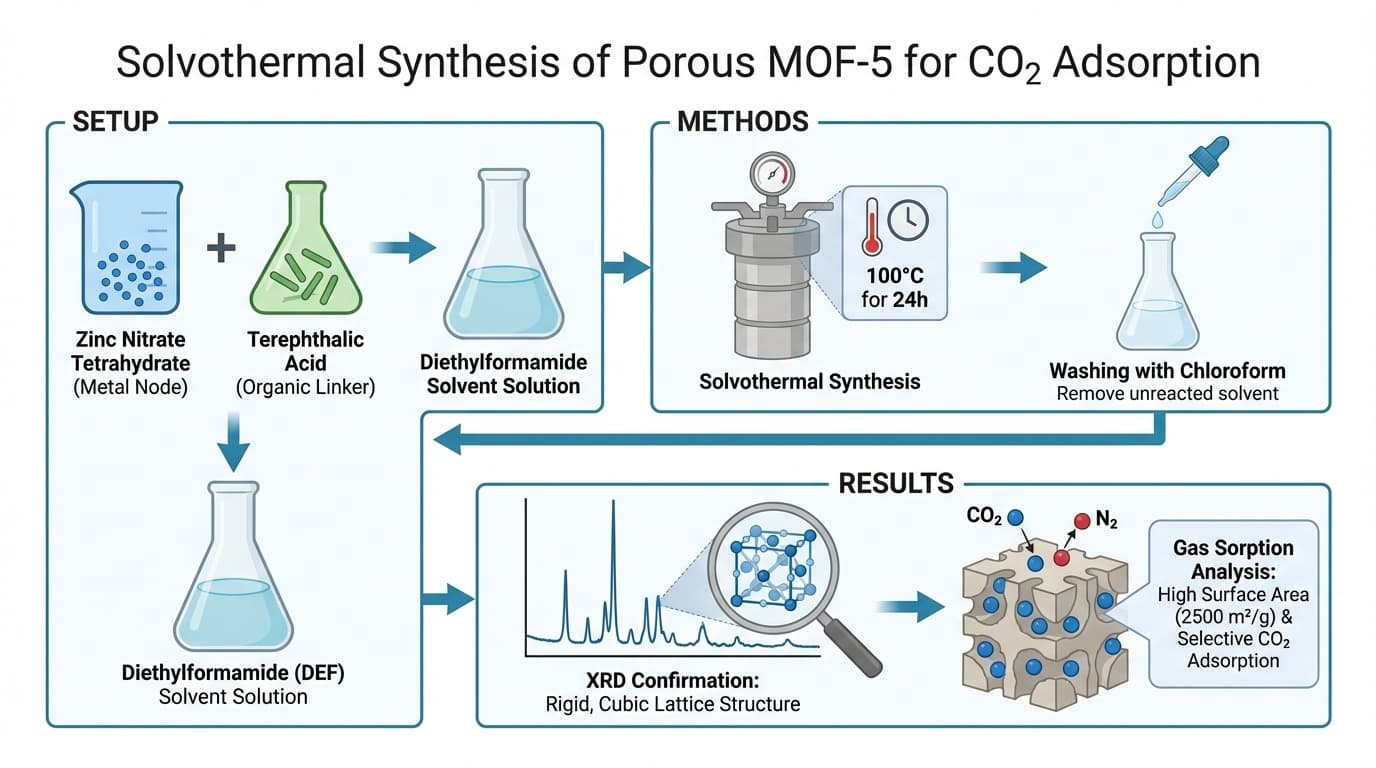
Metal-Organic Framework (MOF) Synthesis for Carbon Capture
Data Visualization
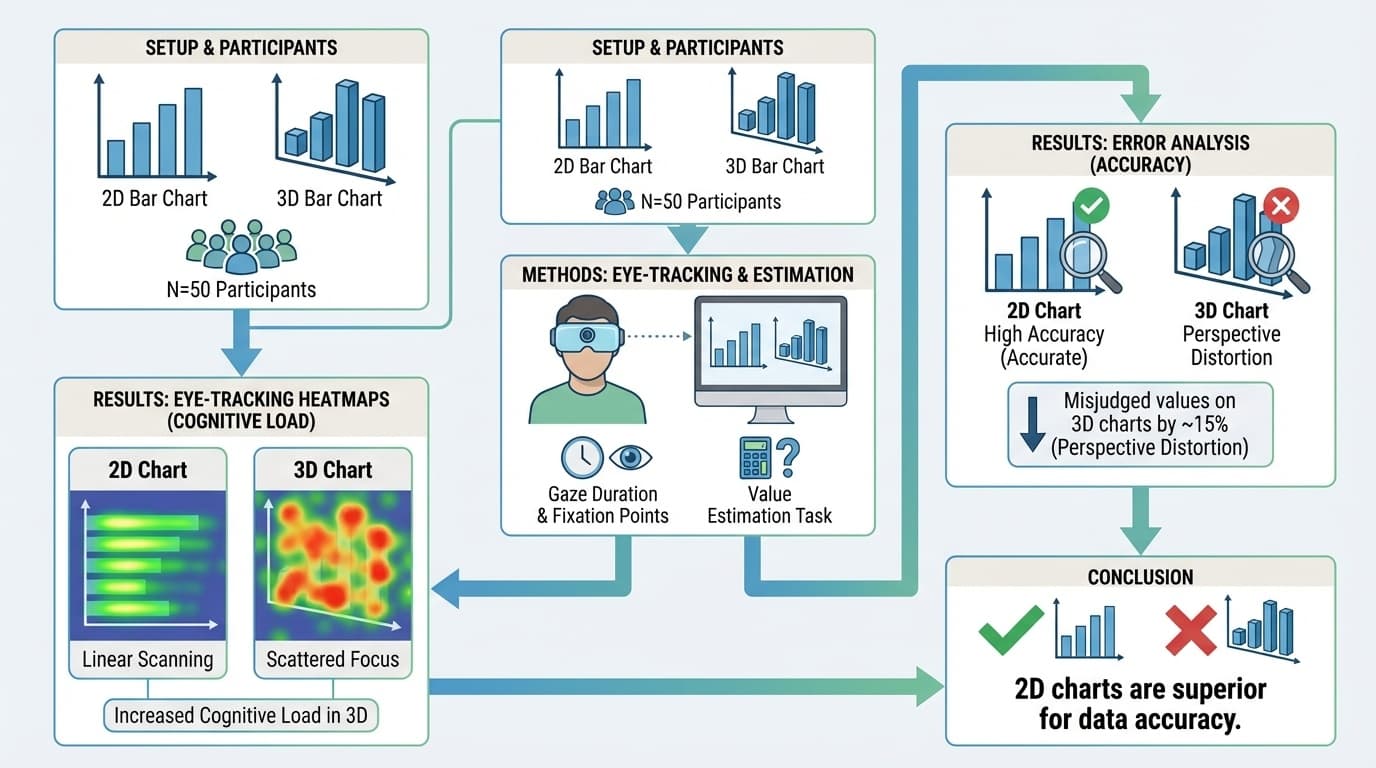
Human Perception of 2D vs. 3D Bar Charts
Cell Biology
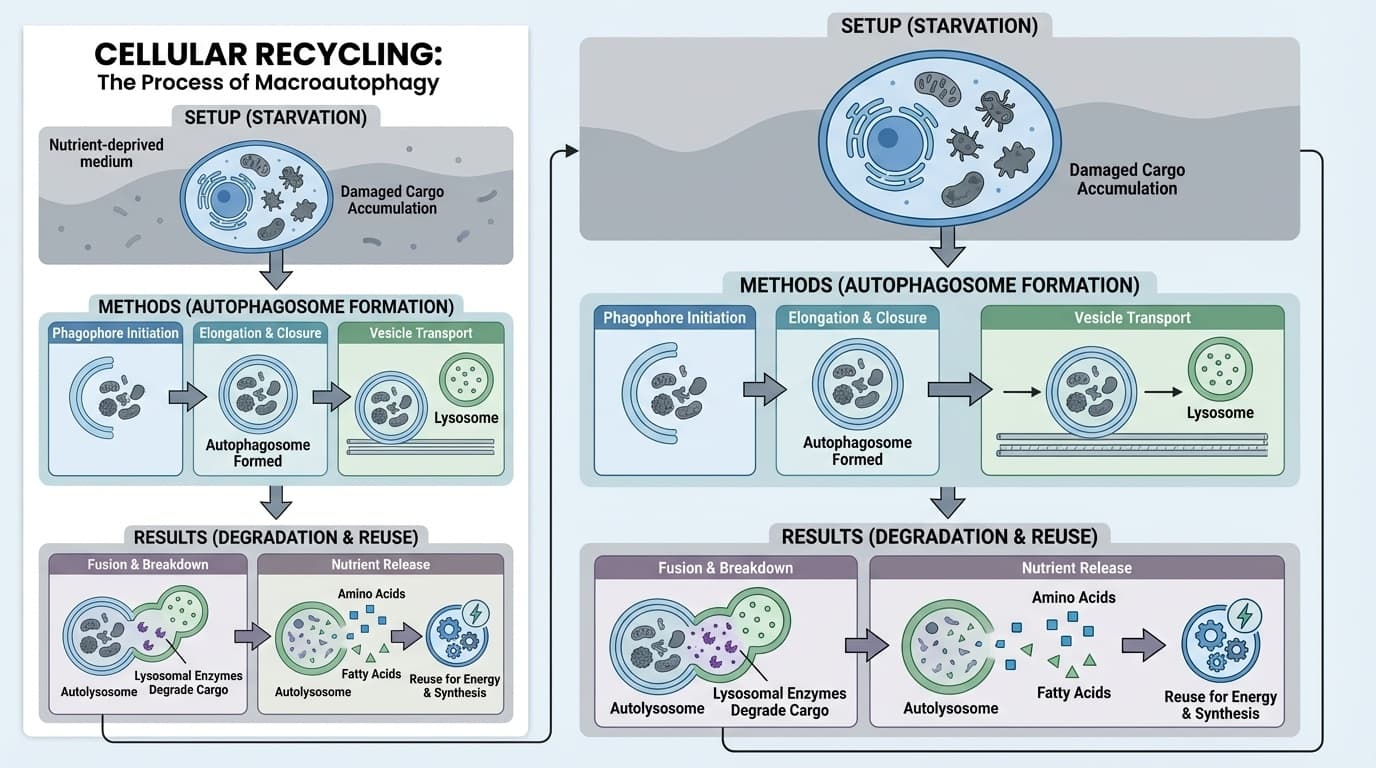
Autophagy Mechanisms During Starvation
Engineering
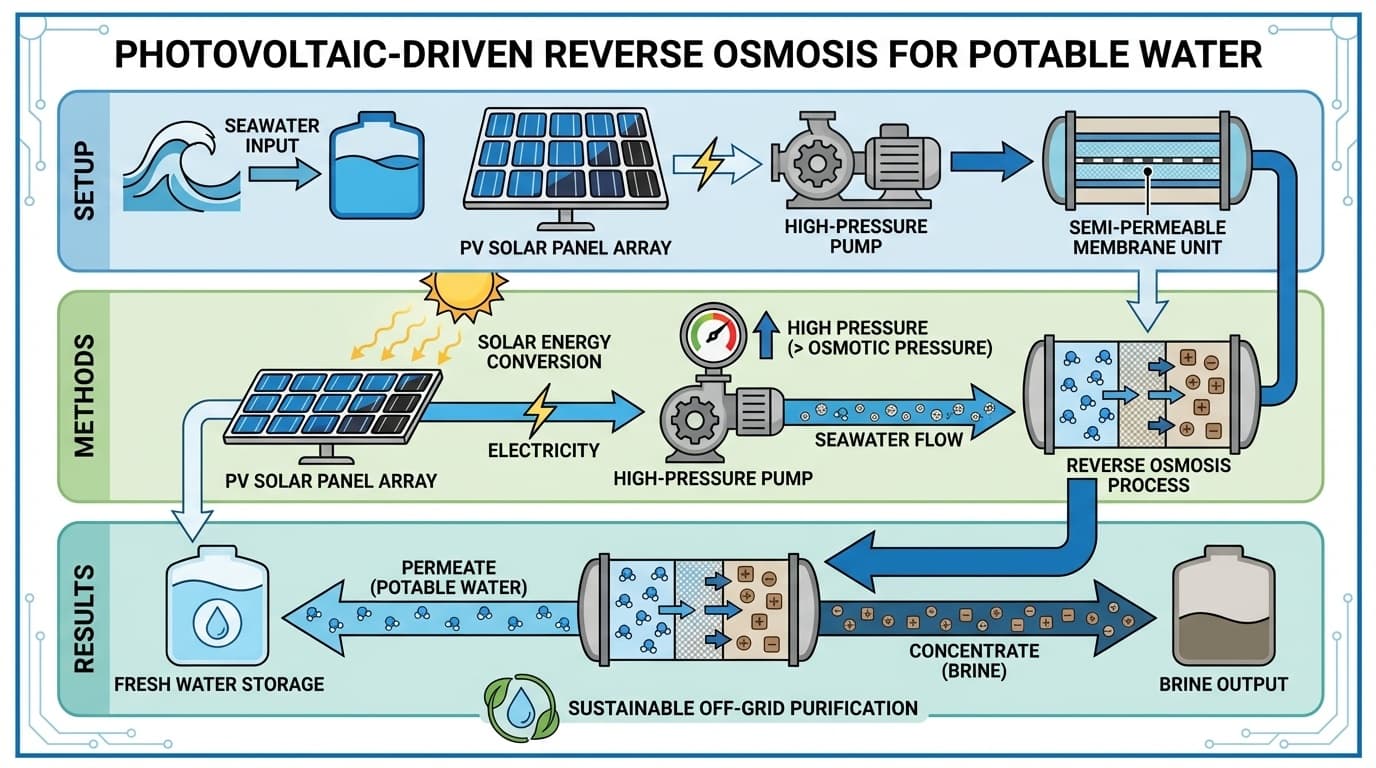
Solar-Powered Water Desalination
Built for scientific precision
Every visual is generated with accuracy in mind. Our models are trained on peer-reviewed literature and validated structures.
SVG, PNG, JPG, PDF up to 4K resolution
Adjust colors, labels, layouts after generation
Track changes and iterations automatically
Generate references for your visuals
Lightning fast
What used to take hours in illustration software now takes seconds. Iterate quickly and explore multiple variations.
Scientifically validated
Our AI understands scientific concepts, nomenclature, and conventions. Results are based on established research.
Privacy first
Your content is encrypted, only you can see it. Learn more
Version control
Track every iteration and change.
Simple, powerful workflow
From idea to publication-ready visual in three steps
Describe your visual
Use natural language to describe what you need. Be as specific or general as you want.
AI generates instantly
Our model creates an accurate representation based on scientific literature.
Refine and export
Make adjustments, customize styling, and export in any format you need.
Trusted by researchers worldwide
Used at leading institutions and research centers
"GraphVision has transformed how I create figures for publications. What used to take hours now takes minutes, and the accuracy is remarkable."
Molecular Biologist
İstanbul Technical University
"The best tool for creating scientific diagrams. The AI truly understands what I need without requiring complex software knowledge."
PhD Candidate
Bilkent University
"My students love using GraphVision for their lab reports. The quality rivals professional scientific illustrations."
Professor of Chemistry
İzmir University of Economics
Start creating today
Join thousands of researchers generating publication-ready scientific visuals in seconds
No credit card required • Free tier available • Cancel anytime